Back
Contents
What is a Shooting Star Candlestick Pattern?


Demetris Makrides
Senior Business Development Manager

Vitaly Makarenko
Chief Commercial Officer
Shooting star is a reversal trend that predicts the ongoing change from the bullish trend to the downtrend. The pattern falls into the category of one-candlestick patterns.
Key takeaways:
- What is a shooting star candlestick pattern?
- How to identify a shooting start candlestick on a chart?
- How to trade according to the signals given by the shooting star candlestick pattern?
- What are the pros and cons of the pattern?
What Does a Shooting Star Candlestick Look Like?
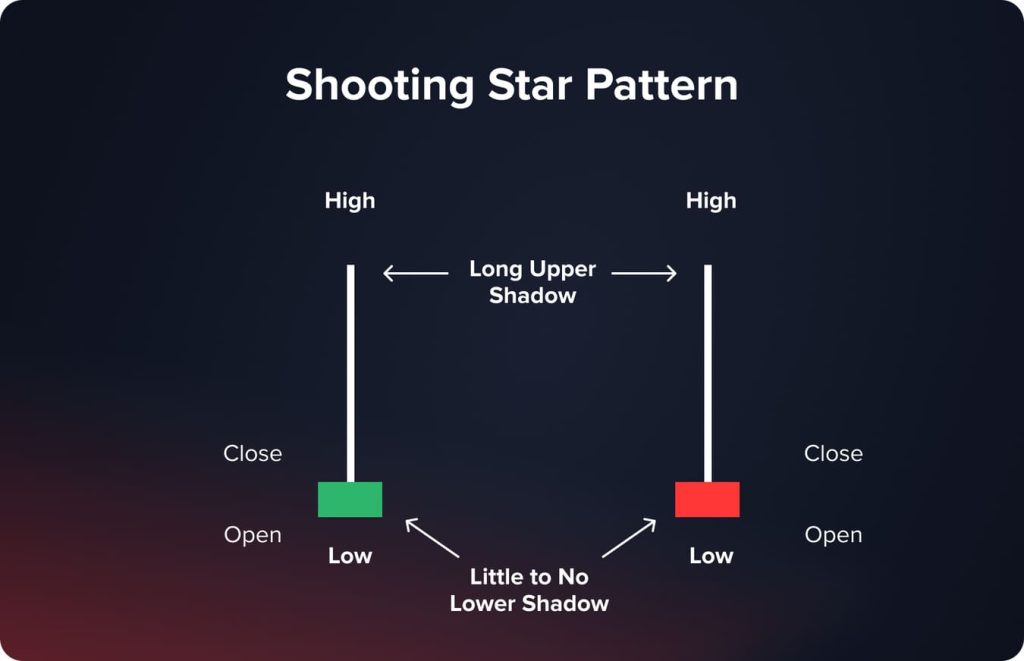
Shooting star is a candlestick that contains a small body, short and barely noticeable lower shadow, and long upper shadow.
The pattern got its nickname because of its resemblance to a falling star. When a celestial body falls, it leaves a trail behind it. As for the color, a shooting star candlestick can be painted both red and green; meanwhile, red (bearish) ones provide traders with stronger signals.
The Market Situation that Corresponds to a Shooting Star Candlestick
When a trader identifies a shooting star candlestick on a chart, the following market situation takes place:
Since the beginning of a trading session the buyers have been making attempts to take control in the market into their hands but hadn’t succeeded. By the end of a trading session an asset’s price returned back to the opening range.
When a trader identifies the pattern after the previous bullish movements, the two possible upcoming situations may take place:
- An asset’s price correction is a short-term trend, and its price is going to return back in the bullish track.
- The bulls are exhausted and a shooting star candlestick activates reversal – the bearish trend is going to dominate in the market.
Core Characteristics of the Shooting Star Candlestick Pattern
What are the main characteristics that help traders identify a shooting star candlestick on a chart?
- A candlestick contains a small body, short lower shadow, and long upper shadow.
- The length of its upper shadow should be at least twice longer than a candlestick’s body.
- The pattern always takes place on the top of the bullish trend.
- The color and timeframe do not matter.
Shooting Star Vs Reversed Hammer
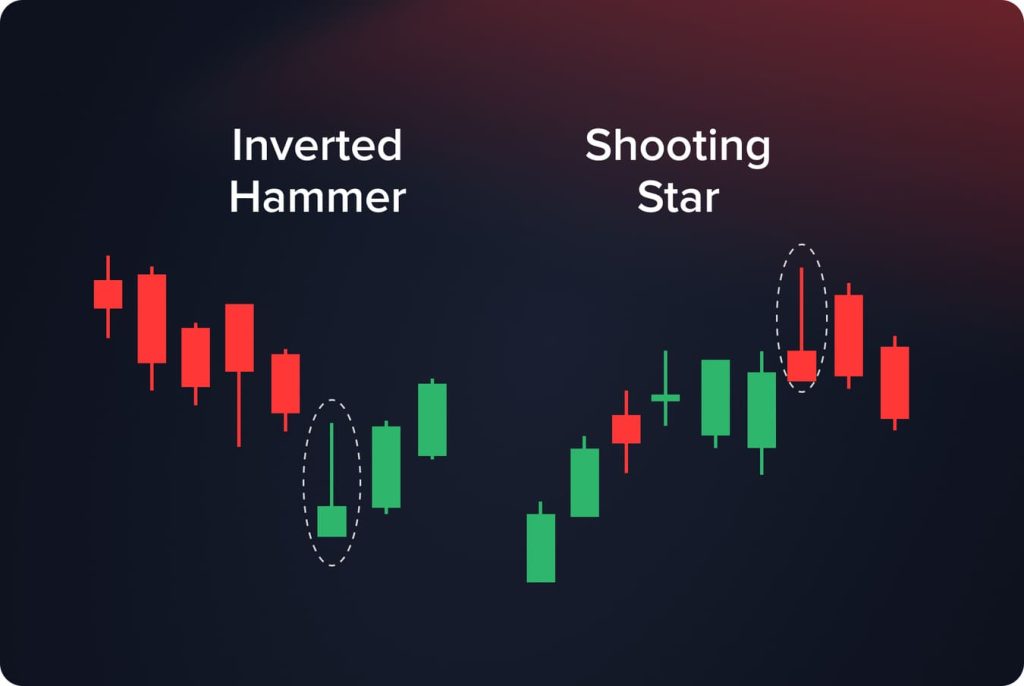
When looking at the array of candlestick patterns, there are two patterns that look similar: Shooting star and Inverted hammer. Both candlestick patterns contain a small body, short or no lower shadow, and long upper shadow. Meanwhile, the above-mentioned characteristics tell us that a shooting start candlestick appears on the top of the bullish trend only. As for an inverted hammer candlestick, it always takes place at the bottom of the bearish trend. That is the core difference between the two patterns.
The Example of a Shooting Star Candlestick
In the image below we see a shooting star candlestick that appeared on the EUR/USD H4 chart. The pattern corresponds to all the above-mentioned characteristics:
- The candlestick appeared on the top of the uptrend.
- The candlestick body is twice shorter than its upper shadow.
- The lower shadow is exceptionally short.
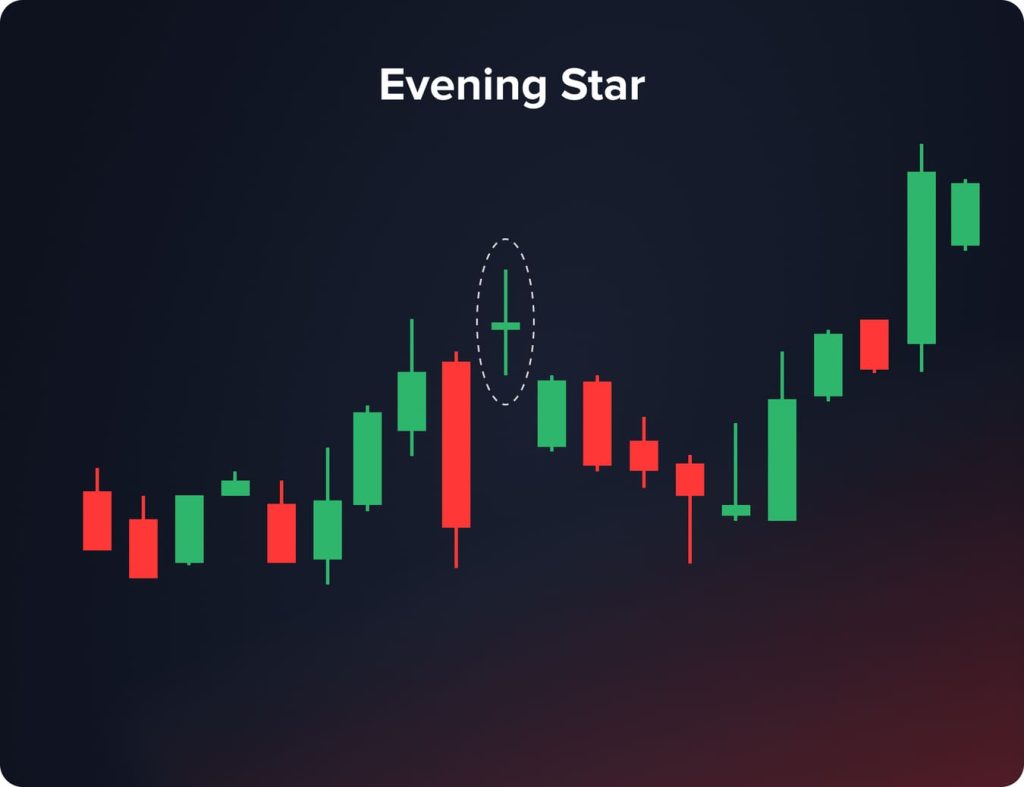
As we see, the candlestick started the trend reversal. The EUR/USD price changed from the bullish movement to the bearish one.
How to Identify the Pattern on the Chart?
Traders need to understand how to identify this pattern properly. Take into account the following three steps:
Step 1. Find the trend top
First and foremost, a trader needs to understand whether the pattern appeared on the top of the uptrend or not. Wait for the reversal movement to break through the resistance level.
Step 2. Identify the pattern on the chart
Shooting star is a one-candlestick pattern; meanwhile, professional traders are looking for two candlesticks to get some proof.
- The first candlestick that precedes the shooting star pattern should be a bullish one.
- The second candlestick can be both bullish and bearish. The candlestick has a small body and long upper shadow. As for the lower shadow, it is either barely noticeable or absent.
- When there is a gap between the previous bullish candlestick and a shooting star candlestick, the signal is exceptionally strong.
Step 3. Wait for the trend channel breakout
When a trader has found a trend top and identified the pattern, he needs to get the confirmation of a trend reversal. The breakout of the lower boundary of the uptrend channel and its retest serves as the confirmation that the bears have taken control of the market.
The Pros and Cons of a Shooting Star Candlestick
The following pros of the pattern are pointed out foremost:
- Traders can easily identify the shooting star candlestick pattern on a chart. It is enough to remember some basic characteristics.
- The pattern is a perfect solution for beginner traders who make their first steps in financial markets.
- When combined with other reversal patterns or reversal technical instruments, the pattern provides traders with strong reversal signals.
What are the weak points of the pattern?
- When appearing within the uptrend, a shooting star candlestick may provide traders with false signals.
- The pattern shouldn’t be used separately without the confirmation of other patterns or technical instruments.
How to Trade Using the Shooting Star Candlestick Pattern?
The pattern falls into the category of the easiest trading patterns; meanwhile, a trader needs to identify a shooting star candlestick correctly and follow some rules when opening a position. What are those rules?
Let’s explain how to trade with the help of a shooting star candlestick. As an example we use the EUR/USD chart (H4).
Looking for an entry point
Foremost, you need to identify support and resistance levels. On the chart we see that the EUR/USD price had several attempts to break the resistance line, and with every attempt the bulls had been losing their power gradually.
When talking about the conservative trading, the breakout of the resistance level helps traders identify an entry point. In case of the more aggressive trading, one may open a position right after the pattern appears on the chart; meanwhile, the signal should be previously confirmed with additional patterns and tech instruments.
Stop-loss and take-profit instruments
Professional traders always use stop-loss and take-profit instruments. According to the risk management rule, traders should set stop-loss orders above the broken support level or in 500 pipettes higher than the entry point.
Take-profit orders should be placed on the support level. To fix the profit traders close their positions right after the appearance of the bullish reversal patterns (e.g., bullish engulfing, hummer, double bottom, etc.).
The Best Strategies to Apply When Trading Based on the Shooting Star Candlestick Pattern
The Confirmation of a Shooting Star by the MACD Indicator
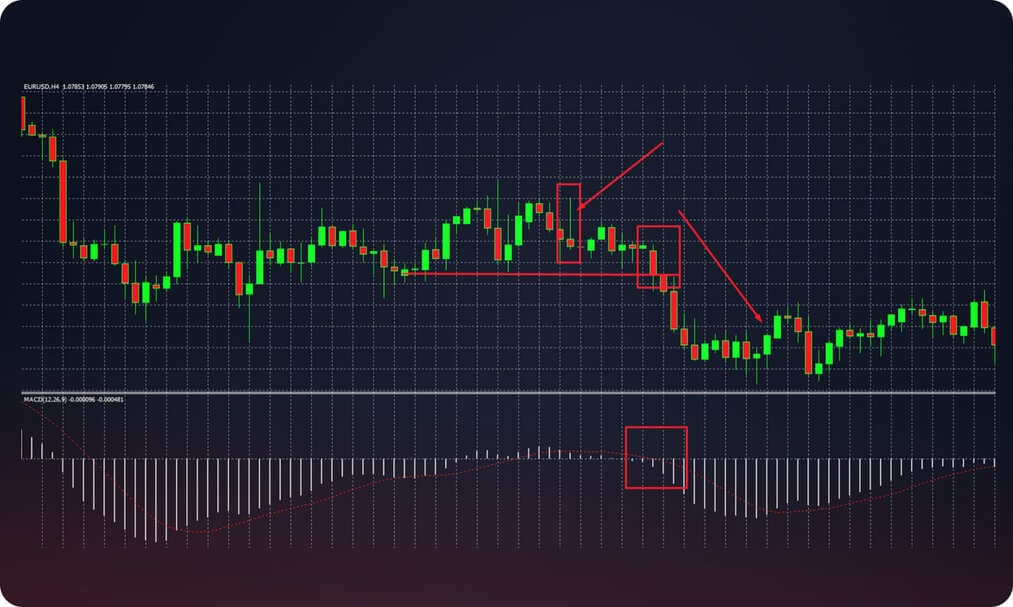
Such a trading strategy is based upon the combination of a shooting star candlestick and the MACD indicator.
A trader activates the MACD indicator on the EUR/USD chart. Settings are default. What are the next steps?
- Identify the shooting star pattern on the chart.
- Look at the MACD indicator. Its line is above zero.
- Find the resistance level and wait till its breakdown.
- Get the signal confirmation from the MACD indicator. When its line moves to the “negative” area, open a position.
On the EUR/USD H4 (4 hours) chart we identify the shooting star candlestick pattern, but the asset’s price breaks the resistance level 8 candles after. The MACD indicator confirms the signal. As such, a trader should open a position where the asset’s price has broken the resistance level.
Intraday Trading with the Help of Shooting Star Candlesticks
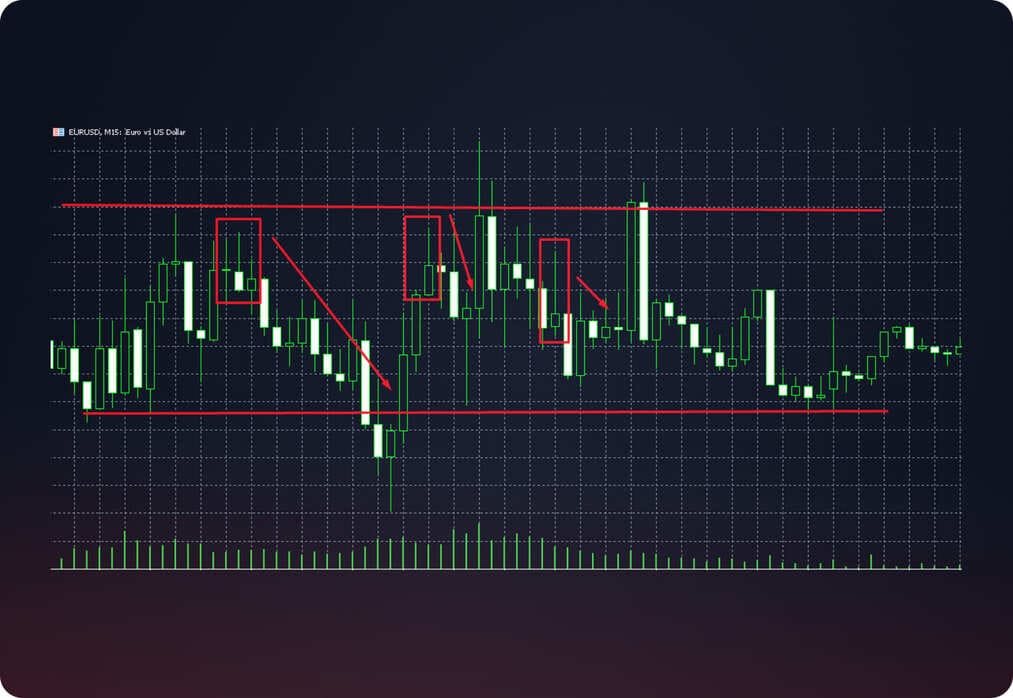
The second strategy is directed at smaller timeframes and implies opening multiple positions based on shooting star candlesticks.
For instance, we are going to trade on the EUR/USD M15 (15 minutes) chart. First of all, we need to identify the support and resistance levels to open positions within the imaginary channel. When a trader identifies the shooting star pattern on the chart, he opens a short position expecting the asset’s price to return in the channel. Furthermore, this strategy enables traders to open long positions when the bullish reversal patterns appear on the chart.
Useful Tips for Trading On Shooting Star Candlesticks
A shooting star itself is a bearish signal; meanwhile, traders need to take some important peculiarities into account before opening short positions:
- When a shooting star candlestick is identified on a chart, find the support and resistance levels.
- Such a pattern gives rather strong signals when it appears on the top of the uptrend. As the price gradually rises, a shooting star candlestick may send false signals.
- The candlestick color doesn’t matter; meanwhile, the red (bearish) candlestick is a stronger bearish signal by default.
- When trading according to this pattern, it is important to use confirmations with the help of other patterns and tech indicators.
- Set stop-loss and take-profit orders according to your risk-management rules.
- The shorter a candlestick lower shadow, the stronger bearish signal you get. The strongest signals are provided by shooting star candlesticks with no lower shadow.
- Shooting star candlesticks are effective in all financial markets and timeframes.
The Bottom Line
Shooting star is a bearish candlestick pattern that appears on the top of the uptrend; meanwhile, such a pattern may provide traders with false signals. Here is why, professional traders prefer to get some confirmations before opening short positions. Other reversal bearish patterns or tech indicators can confirm the trend reversal. Furthermore, the pattern can be used in aggressive trading – one identifies support and resistance levels and open positions taken into account that an asset’s price should move within a channel.
FAQ
Higher timeframes are better for conservative trading confirmed by other bearish patterns and tech indicators. As for aggressive trading, open positions on younger timeframes.
Yes, the pattern is equally useful in all financial markets no matter how volatile the markets are. Meanwhile, when talking about high volatility, traders need to find more confirmations of a signal.
Professional traders open short positions when an asset’s price breaks the resistance level after a shooting star candlestick pattern appears on a chart.
Updated:
February 3, 2025

