Назад
Contents
The Top-15 Best TradingView Indicators

Trading

Iva Kalatozishvili
Business Development Manager

Demetris Makrides
Senior Business Development Manager
Professional traders open positions based on signals brought by different tech indicators. Technical analysis is the best way to study and predict price movements and trends. TradingView is a platform that unlocks access to more than a hundred tech instruments and graphic tools so that the platform is understood as the most widely used analytical terminal.
What are the best TradingView indicators traders rely on when building their strategies up?
- Moving Average
- Relative Strength Index
- Stochastic Oscillator
- Moving Average Convergence Divergence
- Ichimoku Cloud
- Volume
- Bollinger Bands
- Parabolic SAR
- Aroon
- Directional Movement Index
- Williams Alligator
- On Balance Volume
- Keltner Channels
- Supertrend
- Fibonacci Retracement
MA (Moving Average)
Moving Average is among the oldest tech indicators. R. Donchian and J. Hurst are the first experts who integrated MA in technical analysis in 1930-s.
The indicator is based upon the average price value for a selected time period. Moving Average is a trend indicator that smooths volatility and helps determine future price movements. SMA (Simple Moving Average) is the most widely used variation of the indicator. Meanwhile, there are EMA (Exponential), SMMA (Smoothed), WMA (Weighted), and other variations.
On the chart the Moving Average indicator takes the following form (e.g. SMA 20):
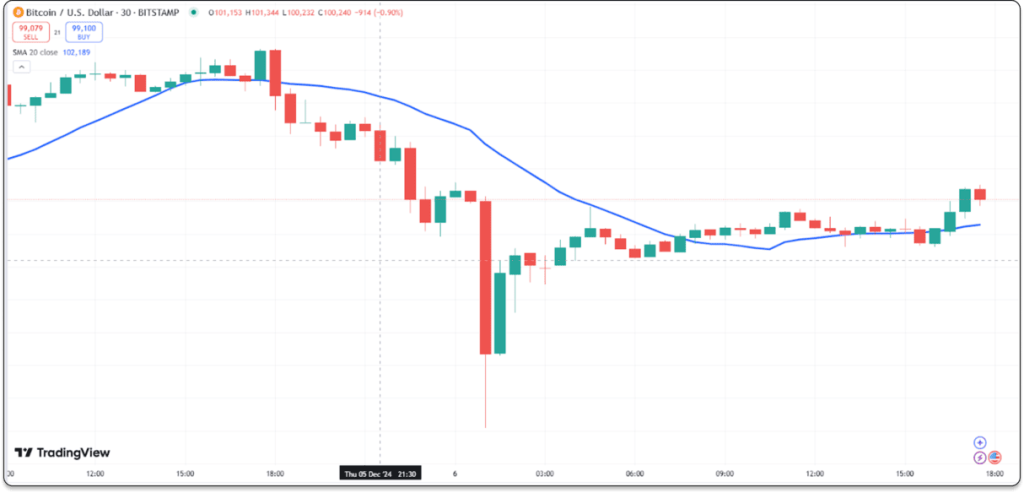
Configurable settings: Type, Length, Source.
Pros
- The indicator smooths the price movement line ignoring market noises and sudden price ups and downs.
Cons
- The MA indicator slower responds to sharp price changes that happen at market reversal points.
Relative Strength Index (RSI)
The RSI indicator was introduced by J. W. Wilder in 1978. The principles of the indicator were described in his book “New Concepts in Technical Trading Systems.”
Relative Strength Index is an impulse oscillator instrument that is used for measuring the magnitude and speed of price movements. The instrument measures an asset’s price changes within the given time period, divides the average increase by the average decrease, and displays the results from 0 to 100. Traders use the RSI index to understand when an asset is either overbought or oversold.
On the chart the RSI indicator takes the following form (default settings):
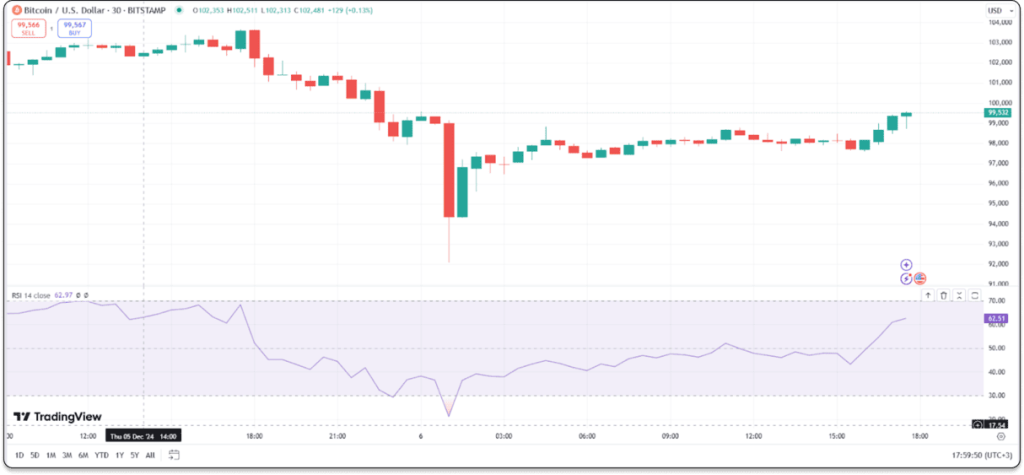
Configurable settings: RSI Length, Source.
Pros
- The indicator is simple and convenient for both beginners and professionals.
- RSI provides traders with the data on the latest price impulse.
- The instrument helps determine divergences.
Cons
- On a trend market RSI is less effective.
- The indicator doesn’t take volumes into account.
Stochastic Oscillator
The Stochastic Oscillator was created by G. K. Lane in the late 1950-s. As of today, the indicator still falls into the category of the most widely used tech instruments.
What does the instrument give traders? Stochastic identifies the interdependence between the latest closing price to the minimum and maximum prices within the given time period. The results are displayed in percentage terms. The indicator tells traders whether an asset is overbought or oversold for opening reversal positions.
On the chart Stochastic Oscillator takes the following form (default settings):
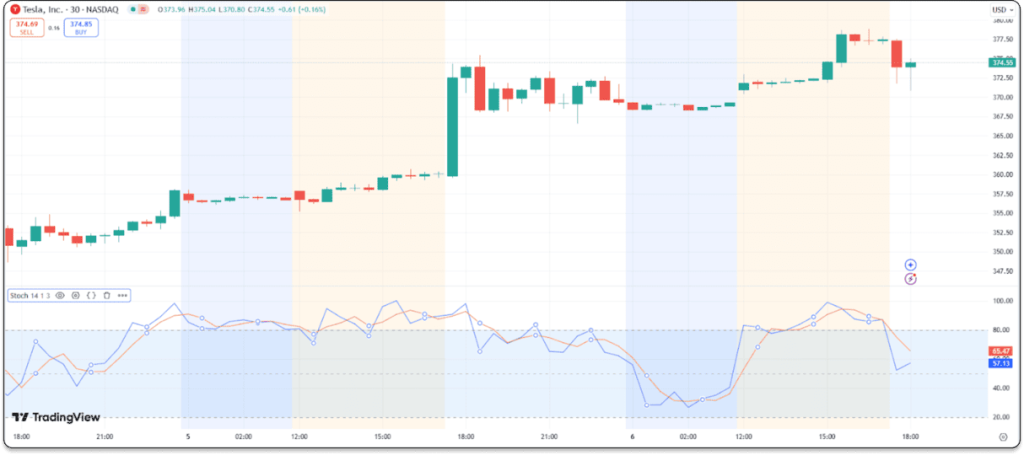
Configurable settings: %K Length, %K Smoothing, %D Length.
Pros
- The indicator provides traders with a set of different signals: overbought and oversold areas, divergence, etc.
- Stochastic is compatible with any timeframes.
Cons
- The instrument is effective enough only when combined with other tech indicators.
- When used on some timeframes, the oscillator provides traders with a lot of false signals.
Moving Average Convergence/Divergence (MACD)
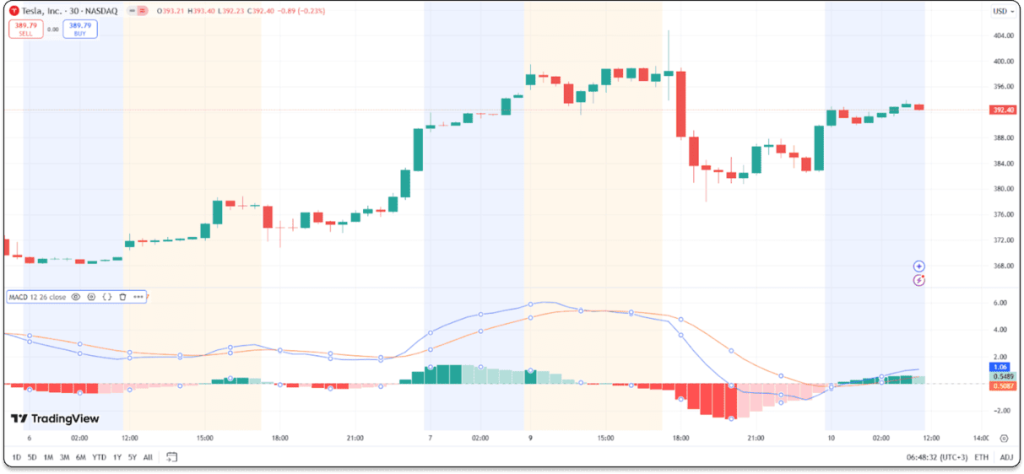
The MACD indicator is based upon the two moving averages and displayed in the separate window below a chart.
The instrument shows the histogram helping traders understand the convergence and divergence between two moving averages. When the divergence occurs, the histogram bars are higher and vice versa. Here is why, MACD histogram bars rise during strong price movements and stay short during flats.
On the chart MACD takes the following form (default settings):
Configurable settings: Fast Length, Slow Length, Source, Signal Smoothing, Oscillator MA Type, Signal Line MA Type.
Pros
- The indicator helps traders identify current market trends.
- MACD is used to evaluate a trend impulse.
Cons
- The instrument falls into the category of lagging ones.
- MACD may provide traders with a lot of false signals.
You may also like

Ichimoku Cloud
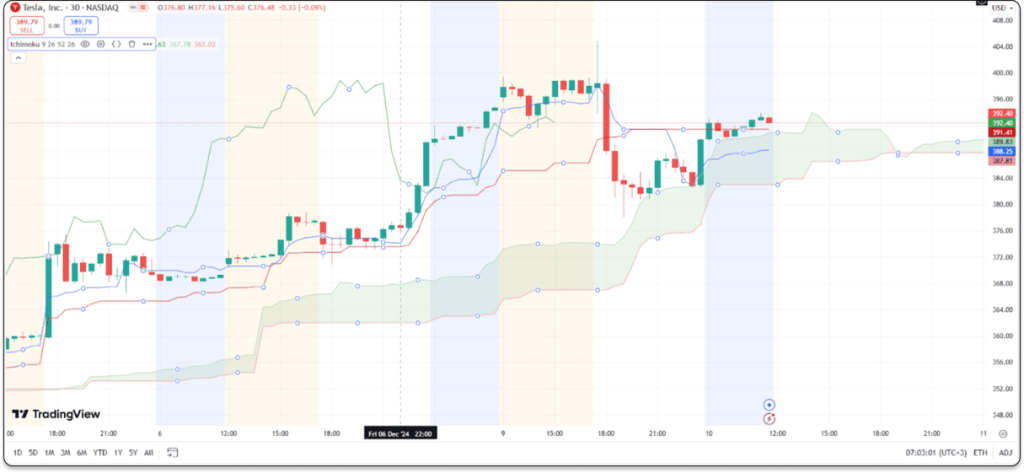
Ichimoku Cloud is a tech indicator founded by Goichi Hosoda, a Japanese analyst, in 1960-s. Such an instrument contains five lines and serves as a fully functional system to analyze the market.
The instrument is used to identify both market trends and impulses for entry and exit. Furthermore, traders use Ichimoku Cloud to predict the nearby support and resistance levels. The system contains both lagging and leading indicators; which is why traders get the fullest image of what is going on.
On the chart Ichimoku Cloud takes the following form (default settings):
Configurable settings: Conversion Line Length, Base Line Length, Leading Span B Length, Lagging Span.
Pros
- The signals provided by Ichimoku Cloud are rather strong.
- Traders can easily identify support and resistance levels that are going to be tested.
Cons
- The indicator is somehow complicated, especially for beginners.
- Traders have to combine Ichimoku Cloud with other tech instruments.
Volume
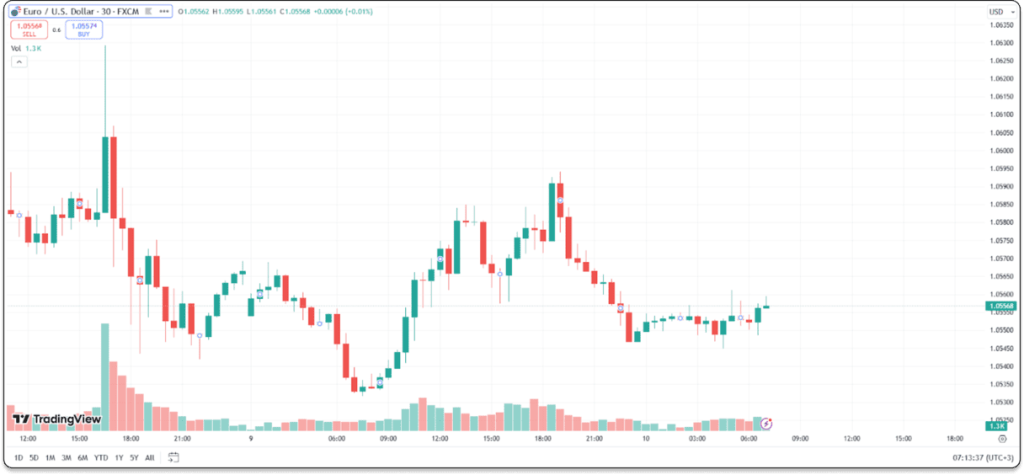
The Volume indicator provides traders with the information about trading volumes on a selected market. Traders understand the liquidity and market activity referred to a certain asset. The instrument was founded by Richard Wyckoff in the early 1900s.
The instrument is displayed as a histogram below an asset’s chart. It shows the overall number of shares/contracts traded within a certain time period. In tech analysis the Volume instrument helps traders identify trend strength, price breakdowns, market liquidity, and divergence patterns.
On the chart the Volume indicator takes the following form (default settings):
Configurable settings: MA Length.
Pros
- The Volume indicator is one of the easiest instruments to interpret.
- The instrument is effective on all timeframes and compatible with other tech instruments.
Cons
- On decentralized markets the indicator gives a lot of false signals.
- The instrument belongs to the lagging ones reflecting past market data.
Bollinger Bands
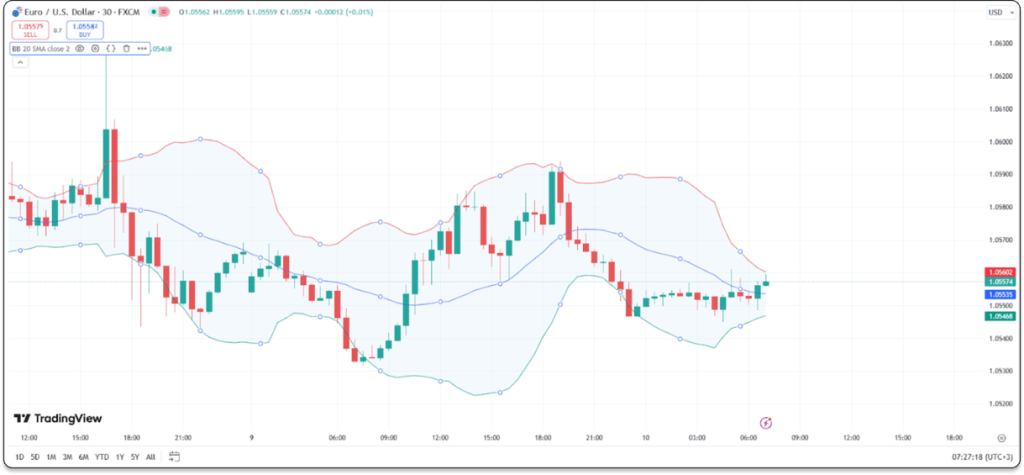
Bollinger Bands is a volatility indicator founded by John Bollinger in 1980-s. Bollinger Bands are exceptionally simple to interpret as the instrument tells traders when an asset is overbought or oversold.
The indicator contains three lines: Simple Moving Average and two standard deviation lines (positive and negative). As such, the three lines form a channel where an asset’s price is supposed to move. When the price touches the upper border, an asset is overbought. In case of touching the lower border, an asset is oversold.
On the chart the Bollinger Bands instrument takes the following form (default settings):
Configurable settings: Length, Basic MA Type, Source, StdDev, Offset.
Pros
- One of the easiest tech indicators, suitable for beginners.
- Bollinger Bands are used in many trading strategies when combined with other instruments.
Cons
- Bollinger Bands are effective on volatile markets.
- When an asset’s price touches either the higher or lower border of the channel, it can break. The indicator may provide traders with false signals.
Parabolic SAR
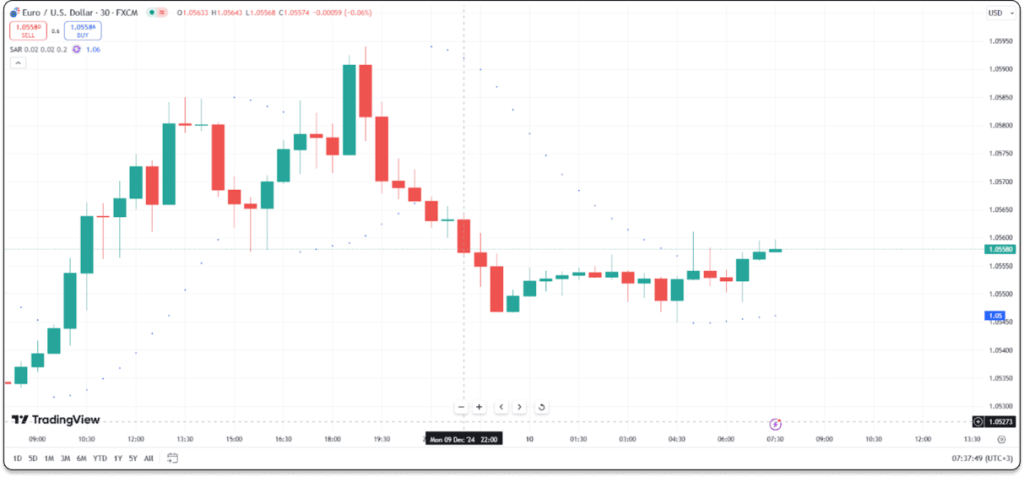
Parabolic SAR is a tech indicator that helps traders identify trends and signals for buying and selling. When compared to MACD or Stochastic, this oscillator instrument determines the trend direction and the trend reversal point as accurately as possible (up to one bar).
Parabolic Stop and Reverse takes the form of points that appear on the chart. Within bullish trends Parabolic SAR points are under the bars, and vice versa. Corrections and reversals are marked by the point jumping to the opposite side.
On the chart Parabolic SAR takes the following form (default settings):
Configurable settings: Start, Increment, Max Value.
Pros
- The indicator helps traders hold a position within a trend.
- Parabolic SAR takes both the dynamics of the trend development and its duration into account.
- Traders get minimum false signals.
Cons
- The indicator is not effective on the flat market.
- On smaller timeframes Parabolic SAR is characterized by high sensitivity to market noises.
Aroon
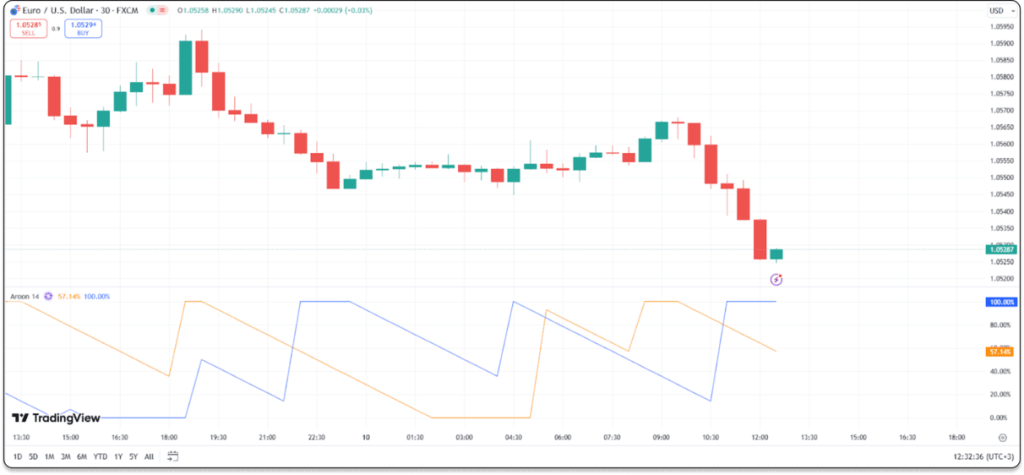
Aroon is a tech instrument used for the identification of a current market trend, its strength and direction. Furthermore, the instrument shows whether a certain trend dominates the market or there are no trend movements.
The instrument measures the time between price highs and lows within a certain period. Aroon consists of two lines: Aroon Up and Aroon Down. Those correspond to the uptrend and downtrend respectively. Each line shows how strong the uptrend/downtrend is.
On the chart Aroon takes the following form (default settings):
Configurable settings: Length.
Pros
- Aroon helps traders easily identify market trends.
- When configurations are correct, the indicator gives strong true signals.
Cons
- Signals are sometimes lagging.
- Within flat movements the instrument may give false signals.
You may also like

Directional Movement Index (DMI)
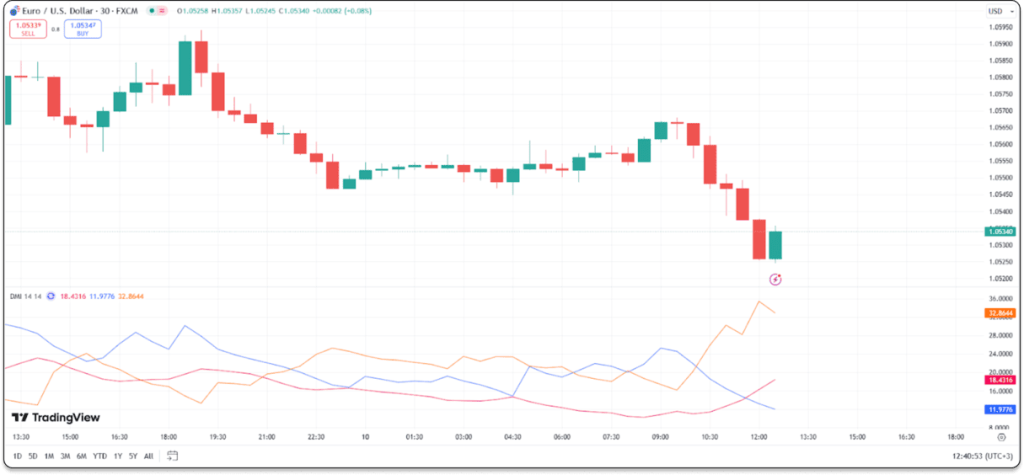
DMI is a tech indicator that is used for evaluating the direction and strength of a market trend. The instrument was founded by J. W. Wilder Jr.
The indicator consists of three elements: positive directional indicator (+DI), negative directional indicator (-DI), and average directional index (ADX). The instrument helps traders understand whose pressure is dominant on the market, bullish or bearish.
On the chart DMI takes the following form (default settings):
Configurable settings: ADX Smoothing, DI Length.
Pros
- DMI is an effective instrument for identifying the dominant market trend.
- The indicator helps traders evaluate the strength of a trend. The intersection of +DI and –DI lines serves as entry and exit signals.
Cons
- DMI is a lagging indicator; here is why the instrument is less effective on volatile markets.
- When asset quotes move in a narrow range, DMI can generate false signals.
Williams Alligator
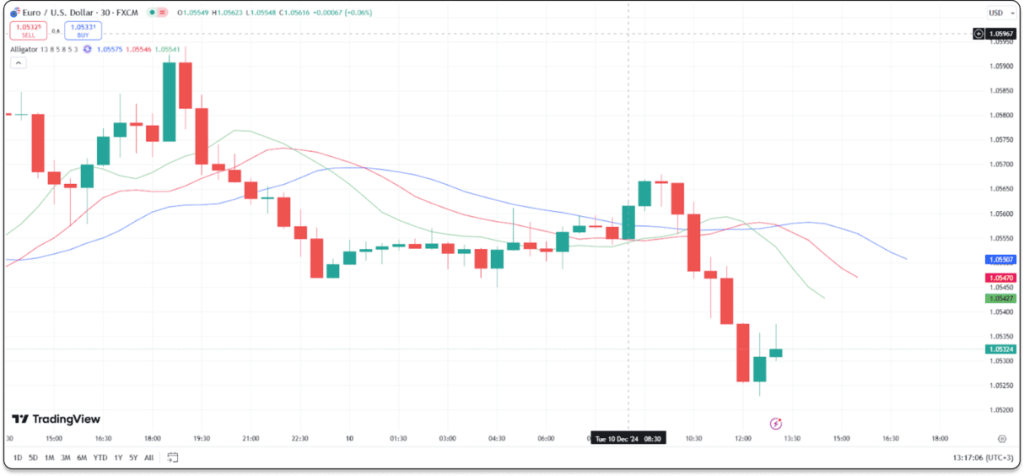
Alligator is among the most widely used Bill Williams indicators that consists of three moving averages (SMMAs).
The fast moving average symbolizes the lips of the alligator. Originally it had the length 5. The medium SMMA has the length 8 and symbolizes the teeth of the alligator. The third SMMA has the length 13 and is named the jaw of the alligator.
Williams Alligator is a fully-functional trading system that can generate signals on its own.
On the chart Williams Alligator takes the following form (default settings):
Configurable settings: Jaw Length, Teeth Length, Lips Length, Jaw Offset, Teeth Offset, Lips Offset.
Pros
- The indicator doesn’t need other confirmations; it serves as a fully-functional trading strategy.
- Within clear bullish and bearish trends, the instrument is the most effective.
Cons
- Traders face a lot of false signals.
- Williams Alligator is a lagging instrument.
On Balance Volume Indicator
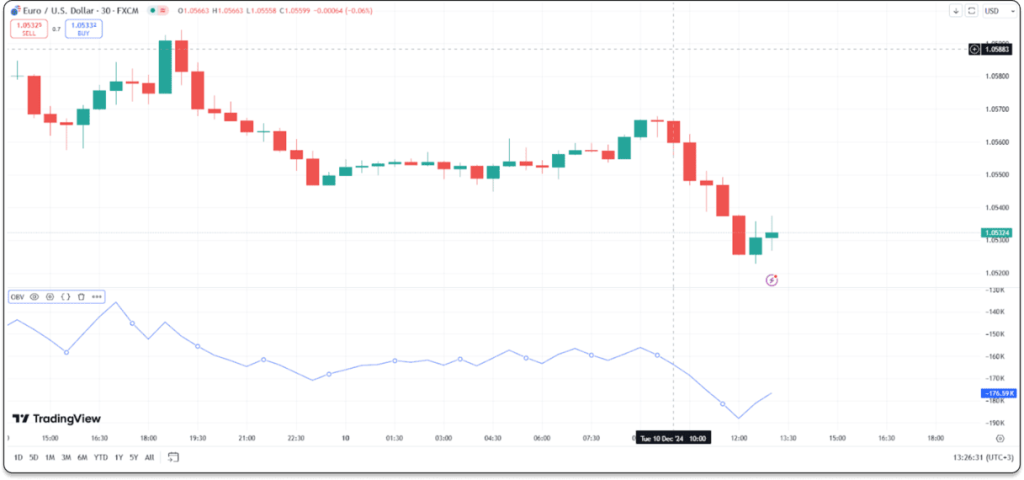
On Balance Volume is one of the basic instruments for volume spread analysis. The indicator was founded by Joe Granville in 1963.
OBV calculates the ratio of price changes and corresponding trading volumes. According to the theory built upon the OBV instrument, rapid volume changes lead to sharp price movements.
On the chart On Balance Volume takes the following form (default settings):
Configurable settings: Type, Length, BB StdDev.
Pros
- The instrument provides traders with a wide diversity of signals.
- OBV gives rather precise signals on higher timeframes.
Cons
- In case of a rapid surge in volumes, the indicator can give false signals.
- OBV is not suitable for assets characterized by low liquidity.
Keltner Channels
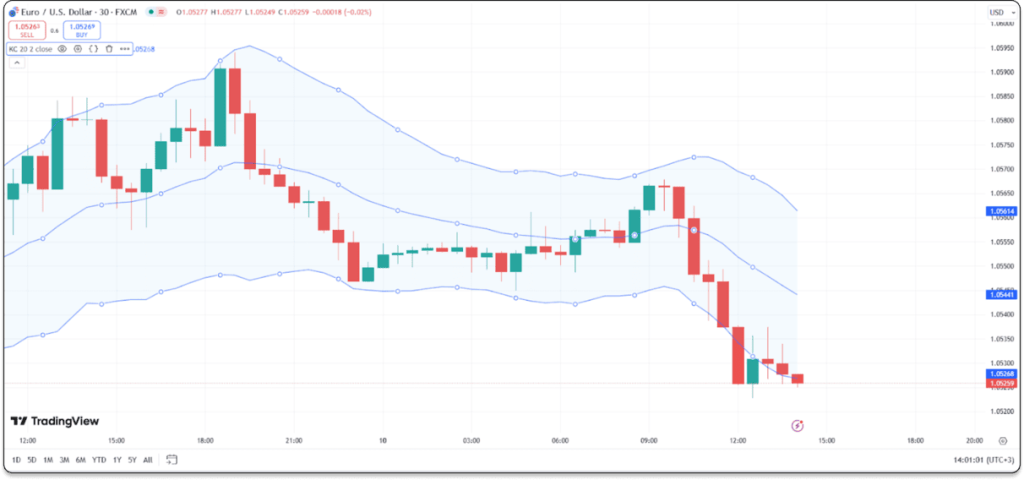
Keltner Channels is an envelope based upon moving averages (EMAs) and linked to an asset’s volatility. The instrument was founded by Chester Keltner in 1960-s.
The indicator falls into the category of trend instruments. When an asset’s price breaks the upper or lower border of the channel, traders get a strong signal for opening a position.
On the chart Keltner Channels takes the following form (default settings):
Configurable settings: Length, Multiplier, Source
Pros
- The indicator gives strong signals when the market trend begins.
- Keltner Channels is effective for both trend movements and the flat market.
Cons
- The instrument is not useful when the fundamental background is too strong.
- In case of incorrect settings, Keltner Channels give too many false signals.
Supertrend
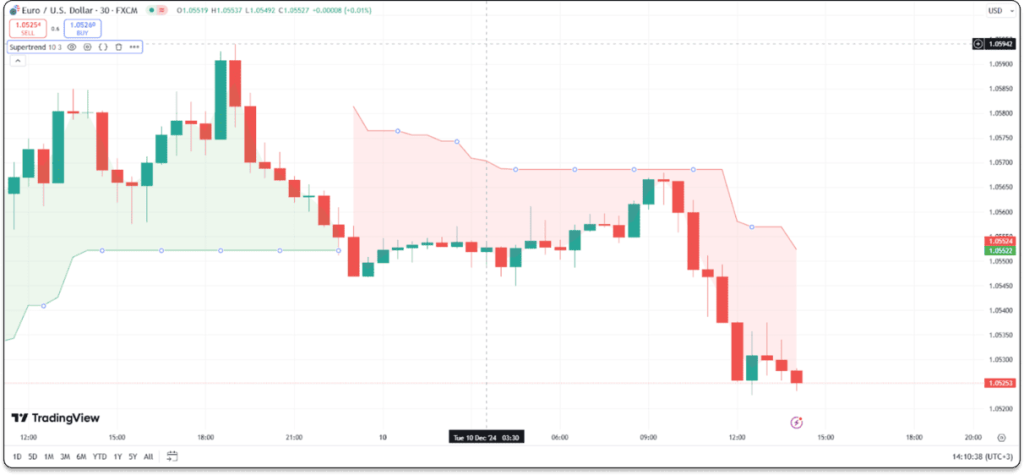
Supertrend is an indicator that is built with the help of Average True Range and Commodity Channel Index instruments.
Both beginners and professional traders use Supertrend to identify a current market trend. When an asset’s price crosses the indicator’s line, traders get a signal for opening/closing their positions. Supertrend is among the easiest instruments to understand and apply.
On the chart Supertrend takes the following form (default settings):
Configurable settings: ATR Length, Factor.
Pros
- The instrument is easy to understand and gives strong signals.
- Supertrend is compatible with different markets and timeframes.
Cons
- Supertrend is a lagging instrument.
- In sideways and choppy markets, the indicator generates a lot of false signals.
Fibonacci Retracement
Fibonacci Retracement is an instrument used for identifying support and resistance levels. The indicator is built upon the Fibonacci levels.
On the chart Fibonacci Retracement takes the following form (default settings):
Configurable settings: Deviation, Depth.
Pros
- The indicator effectively identifies support and resistance levels.
Cons
- Traders need to combine the instrument with other tech indicators.
How to Use Trading Signals Properly?
TradingView instruments provide traders with diverse signals, but there are three core ways to trade with the help of trading signals:
- Signals generation according to your own analytical system. Any combination of technical indicators on TradingView can be used to create trading signals and send them to automation providers for immediate implementation of the user-configured algorithm.
- Signals from top-rated providers. There are special analytical platforms that study the market and create simple trading signals to run automated trading systems.
- Signals from experts and leading analysts. Popular analysts, investors and crypto enthusiasts often publish free advice for their audience and sell paid signals.
Which option is the best one? Beginner traders may use all mentioned ways to upgrade their skills. Professional traders get used to generating trading signals on their own.
The Bottom Line
TradingView is a platform that unlocks access to more than a hundred tech analysis instruments; meanwhile, you don’t need to use as many indicators as possible. In practice, professional traders build the vast majority of their signals with the help of several indicators.
FAQ
All technical indicators have both pros and cons. Their efficiency depends on the timeframe, financial market, and other important factors. Furthermore, there is no instrument that gives 100% precise signals.
Many tech indicators can generate trading signals on their own; meanwhile, professionals prefer to combine them with some other instruments to avoid false signals.
Traders may find a lot of strategies that combine certain tech indicators. Furthermore, you may make experiments combining diverse indicators to find the best combination for your trading style.
Обновлено:
19 декабря 2024 г.
12 марта 2025 г.
ES VERSION OF NEW POST FOR TESTING BLOG AND WP
What is Lorem Ipsum? Lorem Ipsum is simply dummy text of the printing and typesetting industry. Lorem Ipsum has been the industry’s standard dummy text ever since the 1500s, when an unknown printer took a galley of type and scrambled it to make a type specimen book. It has survived not only five centuries, but also […]
